The Dashboard is your command centre inside Agent Builder. It opens automatically when you navigate to Agentic → Dashboard in the WordPress admin and gives you an at-a-glance view of your AI assistants, connected providers, usage statistics, quick actions, and recent activity.
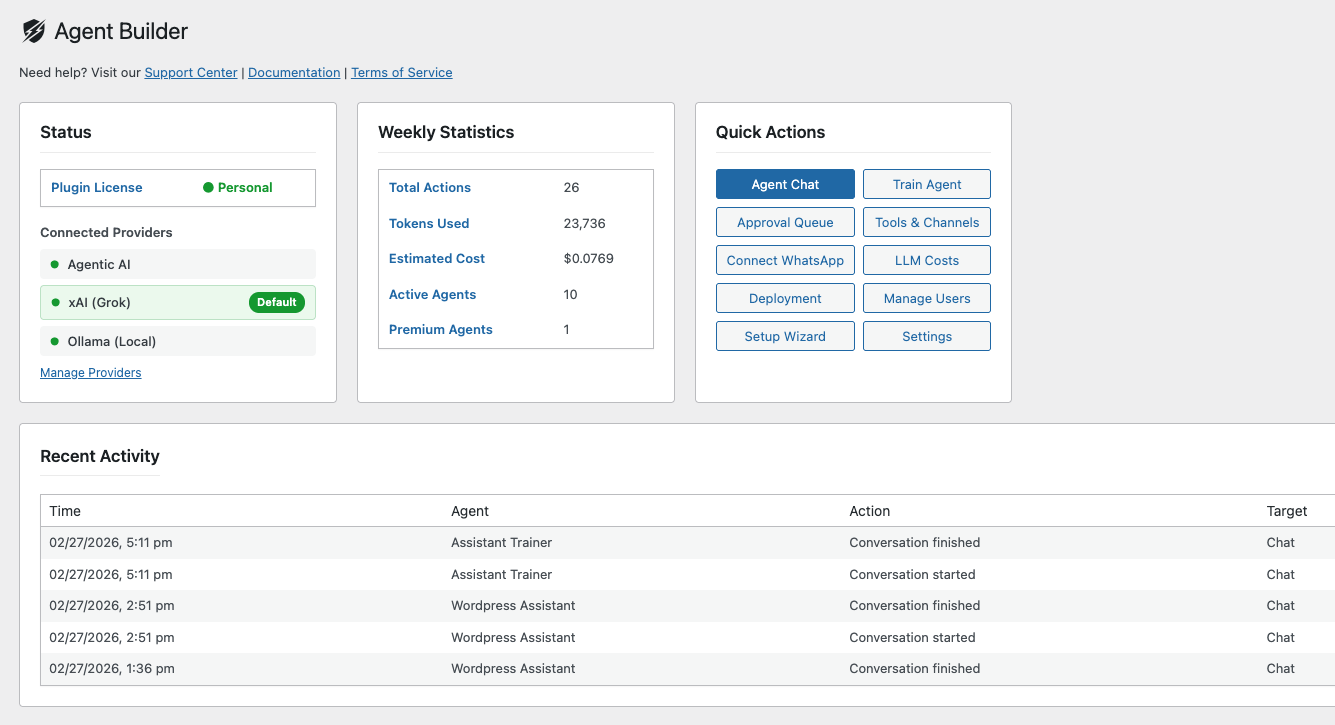
Status
Quick overview of the Agent Builder Plugin Status
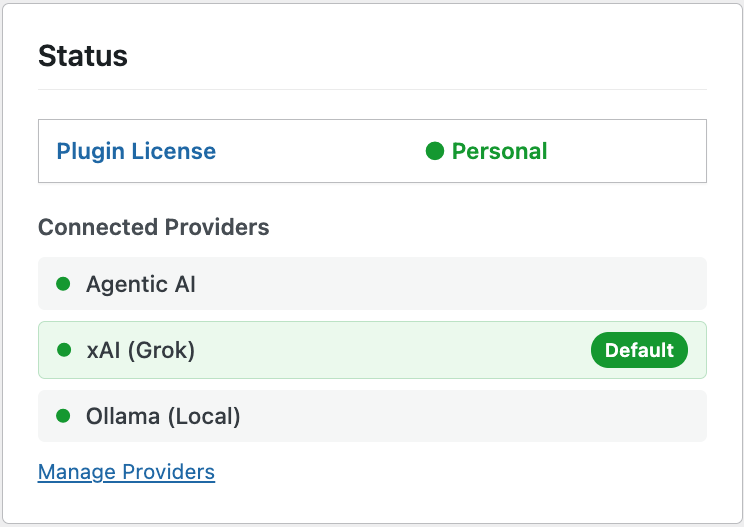
Plugin License
Your current plugin license tier is displayed at the top of the Status card — Free, Personal, or Agency. Active licenses appear with a green indicator; expired or revoked licenses appear in red with a one-click Renew link. Free-tier plugin installs display an Upgrade link to the pricing page.
Connected Providers
Below the WordPress plugin license row, the Status card lists every LLM provider you have configured with an API key. Each connected provider is shown with a green dot. The LLM provider globally used by your AI agents is labelled Default.
Agent Builder supports nine LLM providers out of the box: Agentic AI (free, no key required), OpenAI, Anthropic, xAI, Google Gemini, Mistral, Meta Llama, Cohere, and Ollama (fully local). You can add custom providers or manage the full registry from Manage LLM Providers.
If no LLM providers are connected yet, the Status card shows a prompt to Run the Setup Wizard — a guided flow that walks you through choosing a provider, entering your API key, and testing the connection.
Weekly Statistics
The Weekly Statistics card summarises the last seven days of assistant activity:

- Total Actions — the number of completed agent tasks (links to the Audit Log)
- Tokens Used — cumulative LLM tokens consumed by all assistants (links to Provider Costs)
- Estimated Cost — calculated from token usage at your provider’s configured rates (links to Provider Costs)
- Active Agents — how many AI assistants are currently activated on your site (links to Agents)
- Premium Agents — marketplace assistants you have installed; if none, an Add link takes you to the AI Marketplace
Quick Actions
The Quick Actions card provides one-click shortcuts to the features you use most. If no AI provider is configured yet, a warning banner appears with a direct link to configure one.
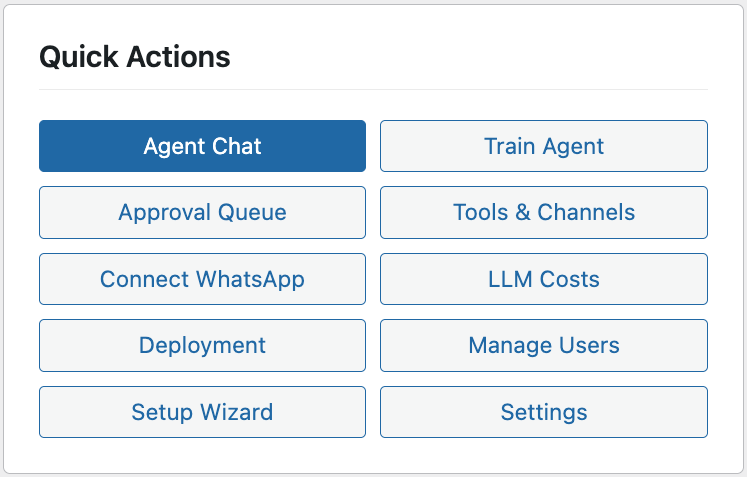
- Agent Chat — open the chat interface and talk to any active assistant in natural language. This button is highlighted when a provider is connected.
- Train Agent — launch the Assistant Trainer directly. Describe the assistant you need in plain English and the trainer creates it for you — no code required.
- Approval Queue — review and approve or reject changes proposed by your assistants before they take effect.
- Tools & Channels — manage the tools your assistants can access and configure messaging channels like WhatsApp.
- Connect WhatsApp — if WhatsApp is not yet configured, this link takes you straight to the WhatsApp setup wizard. Once connected, the button text changes to WhatsApp Channel so you can manage your integration.
- LLM Costs — view the Provider Costs dashboard with 30-day trend charts, per-assistant breakdowns, and cost alerts.
- Deployment — manage where and how your assistants run — scheduled tasks, event listeners, and shortcode embeds.
- Manage Users — control which WordPress users and roles can access Agent Builder features.
- Setup Wizard — re-run the onboarding wizard at any time to add or change AI providers. This button is highlighted if the wizard has not been completed yet.
- Settings — open the full Settings page to manage API keys, models, agent modes, chat themes, and white-label options.
Recent Activity
The bottom of the dashboard displays the five most recent entries from the Audit Log. Each row shows:
- Time — when the action occurred, shown in your site’s configured timezone
- Agent — which assistant performed the action
- Action — what was done (e.g. “Created Post”, “Updated Option”, “Tool Call”)
- Target — the resource affected (post, option, file, etc.)
- Permission — whether the action was auto-approved, required confirmation, or was executed in read-only mode
Click View Audit Log to see the full history with filtering and search.
Support Links
At the top of the page, below the Agent Builder heading, you will find direct links to the Support Center, Documentation, and Terms of Service — so help is always one click away.